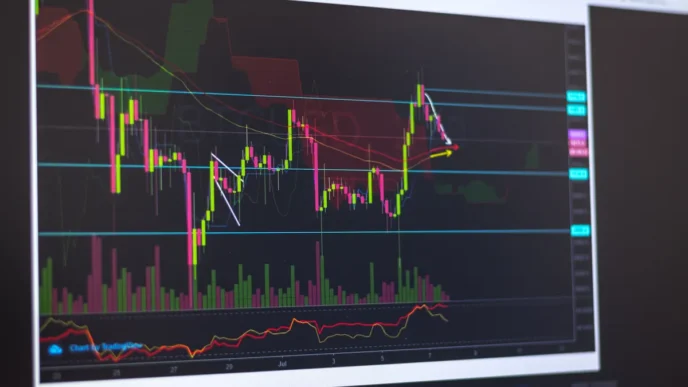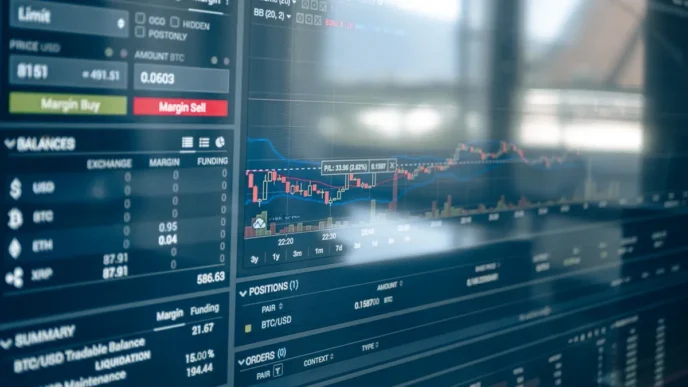
XRP liquidity on Binance has collapsed to its weakest point since 2021, complicating what would otherwise look like a modest recovery after the token rebounded from $1.07 to $1.11 on 15 July. The 30-day liquidity index on Binance has fallen to 0.053, the lowest reading in roughly four years, according to CryptoQuant data cited by CoinTelegraph.
The practical consequence is that a single medium-sized order can now shift XRP’s price by 4 to 5% on its own, per AOL’s reporting on market data. That makes clean technical reads harder and breakout signals noisier.
What the Binance Flow Data Is Actually Saying
The 30-day trading volume on Binance stands at roughly 3.77 billion XRP, one of the weakest stretches of activity in recent years, per CoinTelegraph. The seven-day average of XRP flows on the exchange shows withdrawals at 53% against deposits at 46%, back to levels last seen in June 2025, according to analyst Amr Taha as reported by CoinTelegraph.
A rising withdrawal-to-deposit ratio tends to reduce immediately available sell-side liquidity, which is a factor worth tracking if buyers do attempt a push through $1.12. But the backdrop is not straightforwardly bullish: net selling pressure on Binance has been running deeper than it did during XRP’s April lows, per the same AOL analysis.
One piece of context on what’s been driving the selling: CryptoRank reporting on CryptoQuant analysis indicates that large-wallet inflows in the 1M+ XRP band declined after XRP’s 2025 peak. That suggests the recent pullback is more likely a product of leverage liquidations and broader market weakness than coordinated whale distribution.
XRP Liquidity on Binance and the $1.12 Resistance Problem
Analyst Crypto Patel has identified a high-confluence resistance cluster directly around the current price area: a bearish order block, a fair value gap and a breakdown retest all coincide near $1.12. Patel’s downside targets, if XRP fails to clear that level, sit at $1.058, $1.013, $0.95 and $0.90. These are technical scenarios, not price forecasts.
Analyst Cryptorphic added that ‘lower levels seem likely as long as $1.08 remains resistance.’ XRP has since traded above $1.08, which shifts the immediate test to $1.12. A daily close above that level would start to erode the bearish setup; failure to hold the rebound puts the $1.00 to $1.06 support zone back in play.
The MACD, as of 15 July, shows limited improvement: the histogram is slightly above zero, with the MACD and signal lines close together. The read is mild recovery pressure, not a momentum shift. A larger resistance cluster at $1.30 to $1.40 sits well above current price and is unlikely to matter unless $1.12 breaks cleanly first.
Daily trading volume reached approximately $1.29 billion during the 15 July rebound, per crypto.news XRP market data. XRP is still about 6% lower over the past month and remains nearly 70% below its July 2025 record high of $3.65.
The $50 XRP Calculation and Why It Stays Theoretical
Separately, a hypothetical from analyst Moon Lambo has been circulating. The scenario assumes the entire crypto market grows to $100 trillion, with XRP holding roughly its current market share. At approximately 3.2% dominance against a circulating supply of around 62.53 billion XRP per CoinMarketCap, that produces a theoretical price near $50.10. A 1% share implies roughly $16.01; 5% would yield around $80.08.
Moon Lambo was explicit: ‘I’m not making a prediction.’ The inputs (a tenfold-plus expansion of total crypto market cap, stable dominance, unchanged circulating supply) are each individually heroic. As a market-cap identity exercise it works; as a near-term thesis it has nothing to do with the current price structure.
For the next several sessions, the market is focused on far simpler maths. CoinGecko live data shows XRP holding above $1.07. If buyers cannot close above $1.12 on meaningful volume, the $1.00 to $1.06 zone becomes the next magnet. A clean break above $1.12, in a thin order book, could move faster than the technical picture suggests it should.