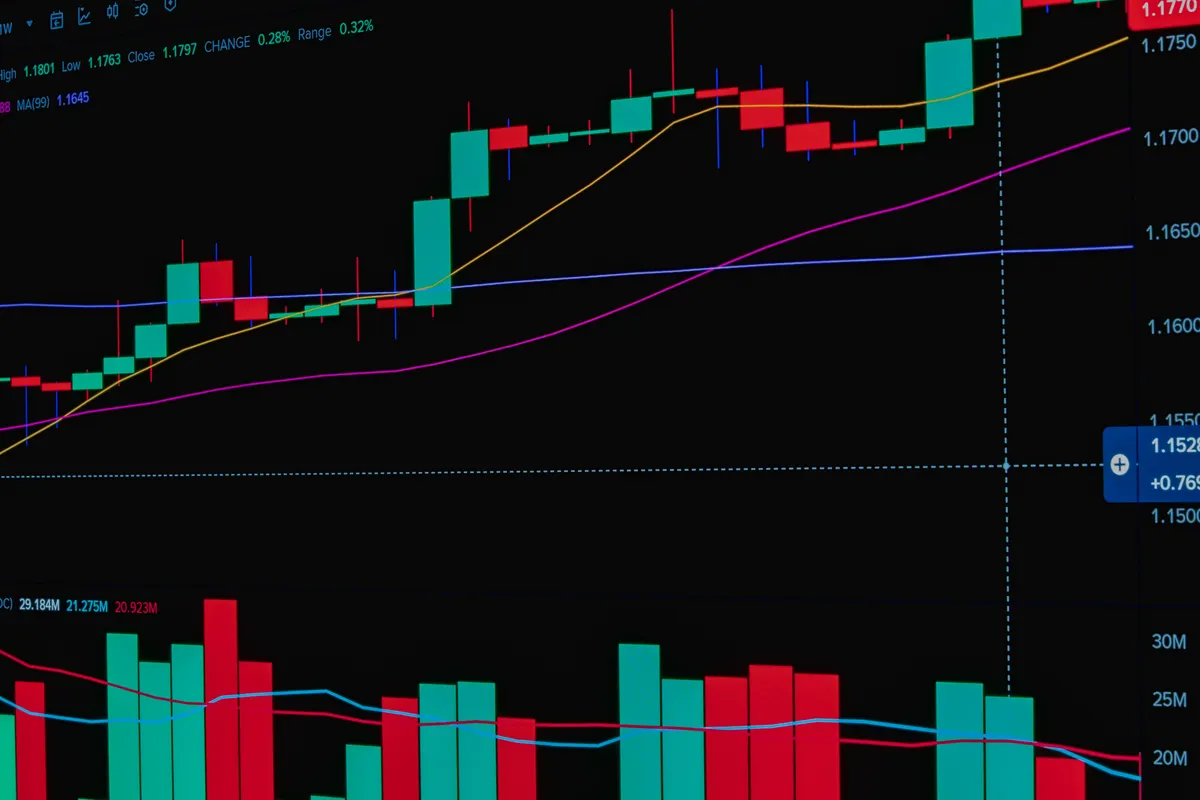
BNB Open Interest Rise Pushes Price Toward $610 Resistance


BNB’s open interest rise is giving the spot price its clearest bullish setup since late July, with $985.79 million in active futures exposure and a recovering daily chart pointing toward the $610 to $616 liquidation cluster overhead.
BNB traded near $600 on 5 August after breaking out of a July consolidation range between $560 and $575. The daily close of $599.64, off an intraday high of $605.88, reclaimed both the 20-day and 50-day simple moving averages at $574.43 and $576.85.
The 100-day SMA at $605.88 is now the immediate test. Wednesday’s intraday high tagged that level exactly, so a sustained 4-hour close above it is the trigger that would open the path toward $610. The 200-day SMA near $636.13 sits well above and would need to be reclaimed before the daily chart signals a broader trend reversal.
The Chaikin Money Flow reading of 0.14 on the daily chart confirms that buying pressure has exceeded selling pressure across the measured period, supporting the near-term recovery thesis.
Open Interest Rise and Derivatives Volume Signal New Positioning
According to CoinGlass BNB futures data, derivatives trading volume climbed 56.1% to $719.9 million alongside the spot move, while open interest increased 4.05% to $985.79 million. Rising price alongside rising OI generally suggests traders are opening fresh positions rather than unwinding, though the data alone does not confirm whether that new exposure is net long or net short.
A snapshot from CoinGlass’s BNB spot and derivatives overview puts BNB’s market cap at approximately $79.92 billion against a circulating supply of 133.16 million tokens. Twenty-four-hour spot volume came in at $87.20 million, with roughly $284,622 in BNB futures positions liquidated in the same window, modest relative to total OI.
The broader context matters here. According to a CoinGlass 2025 annual report, total crypto derivatives volume reached approximately $85.7 trillion last year, averaging $264.5 billion per day. Binance captured roughly 29.3% of that global derivatives flow, as noted by Cointelegraph via TradingView. The single-day BNB derivatives volume reading of $719.9 million sits well inside that run rate, suggesting the current spike reflects a positioning event rather than a structural shift in liquidity.
Liquidation Clusters Frame the Key Levels
The 4-hour chart shows BNB trading near the upper Bollinger Band at $602, with the middle band at $591.92. Price briefly pushed above the upper band before pulling back to $599.50, highlighting seller activity in the $602 to $605.88 zone where the band and 100-day SMA converge.
The 4-hour RSI stood at 63.74, above its signal average of 61.04. Momentum is directionally bullish but the reading is approaching the 70 threshold conventionally associated with overbought conditions, which limits room for further expansion without a consolidation pause.
The three-day CoinGlass liquidation heatmap shows the most concentrated overhead exposure between $612 and $616, with additional leveraged positioning extending toward $620. A clean break above $606 could accelerate into that range as short liquidations add incremental buy-side pressure. Crypto commentator Satoshi Stacker described BNB’s retest of its former diagonal resistance as successful and identified $592 as one of the asset’s most watched levels of 2026. A separate analyst known as Batman pointed to the recovery above the 50-day SMA and the successful retest as preserving the bullish setup.
On the downside, $592 is the first support that matters. Losing it would weaken the breakout structure and expose $581.84, where the lower Bollinger Band and the base of the recent advance coincide.
The MiCA register update referenced in wider market commentary now lists 325 authorised crypto-asset service providers across the European Economic Area as of 12 August 2026, according to the outrun.at MiCA dashboard tracking ESMA’s MiCA register. A separate tracker reported 360 CASPs as of 30 August 2026, with the difference reflecting different snapshot dates. Neither figure constitutes a direct catalyst for BNB; the European licensing backdrop is a secondary macro variable at best.
The binary is straightforward: a 4-hour close above $605.88 sets up a run at $612 to $616, where the liquidation heatmap places its heaviest overhead clusters. A close back below $592 shifts the focus to $581.84 and makes the July breakout look corrective rather than structural.

Shawon Hannan
Shawon Hannan is a crypto markets writer at CryptoNexa. He covers DeFi protocols, layer-1 and layer-2 development, staking and restaking economics, tokenomics and the on-chain data behind the day's headlines. His reporting focuses on mechanism rather than narrative: how a protocol actually works, where the risk sits, and what the flows show. He tracks exchange reserves, TVL, funding and governance activity, and treats every figure as something that has to be traceable to a chain, a filing or a named analyst. He writes on protocol upgrades, exchange and ETF flows, regulation and market moves.