Short-Term Holder Cost Basis at $67,523 Blocks Bitcoin’s Recovery Path

Bitcoin’s short-term holder cost basis is shaping up as the ceiling that matters most right now. With BTC trading near $65,015 on 8 August, the gap between spot price and the $67,523 average acquisition cost of short-term holders is the primary structural barrier to any sustained recovery.
The $67,523 Short-Term Holder Cost Basis as Resistance
CryptoQuant analyst Axel Adler Jr. put the short-term holder realised price at $67,523 as of 8 August, against a BTC spot price of $64,952. That leaves Bitcoin roughly $2,571, or 3.8%, below the average cost basis for coins held fewer than 155 days.
The gap had been wider. Earlier data cited by Coinness, drawing on Adler’s analysis, showed the short-term holder cost basis near $67,300 when BTC was closer to $63,200, representing roughly a 6% average loss for that cohort. The narrowing since then brings more holders within reach of breakeven, which is precisely the problem.
Adler noted that Bitcoin had closed below the short-term holder realised price during 279 of the previous 284 days. As price approaches the cost line, he expects holders to exit: ‘STHs will start dumping into the market to close their positions at breakeven.’ That behaviour would turn the $67,500 zone into a supply wall rather than a recovery target.
Bitcoin would need to absorb that potential selling and then establish support above $67,523 to shift the medium-term structure. The 100-day SMA at $68,052 and the 200-day SMA at $70,295 sit above that level, meaning multiple layers of resistance cluster between $67,500 and $70,300.
4-Hour Setup and Liquidation Clusters
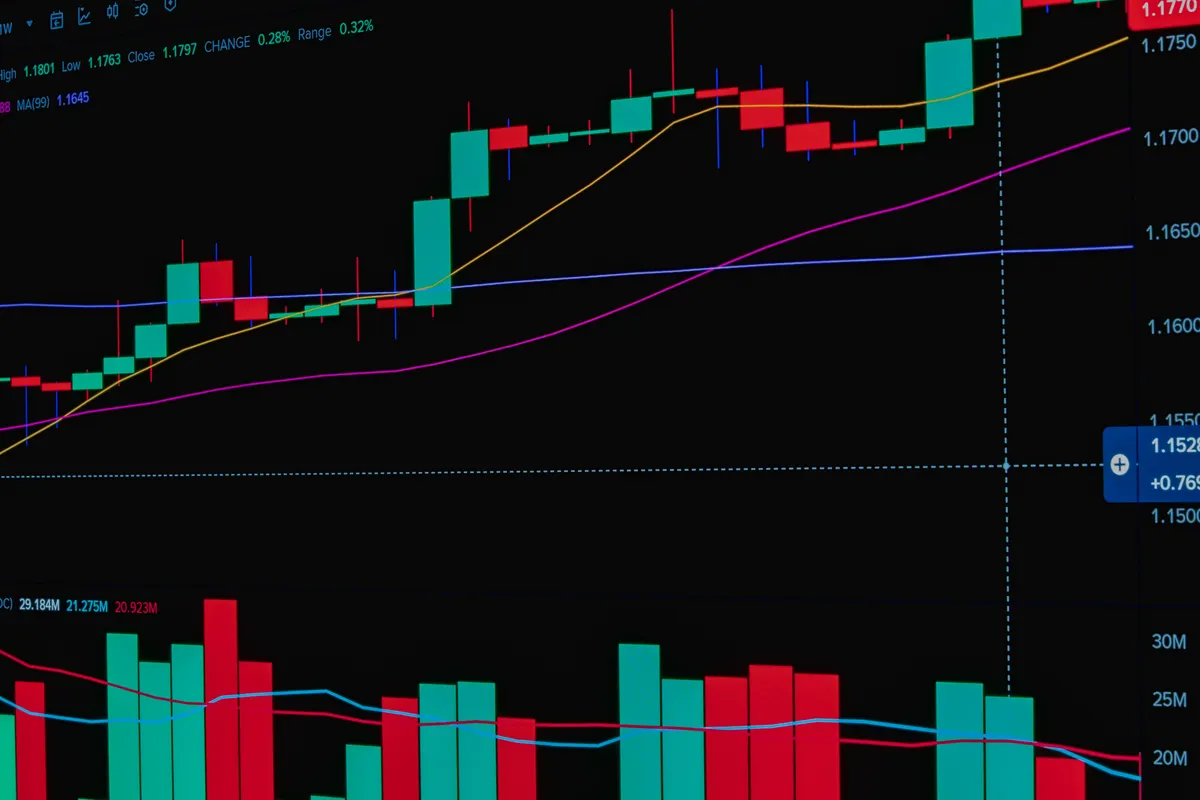
On the 4-hour chart, the picture is more constructive in the near term. BTC is trading above the Bollinger Band midline at $64,647 and approaching the upper band at $65,257. The RSI stood at 61.83, above its moving average of 59.25, giving buyers the momentum edge without pushing into overbought territory.
Analyst Ted Pillows cautioned on 8 August that the situation remained fragile: ‘BTC failed to hold above the $65,000 level. Sellers are still active in this zone, and Bitcoin needs to reclaim it for stronger upside.’
A 4-hour close above $65,257 would open a test of the $65,500–$65,600 range, where CoinGlass data shows the nearest upside liquidation cluster. A sweep through that zone could squeeze short positions and accelerate a push toward $66,000. Larger downside clusters sit around $63,700–$63,900 and near $63,000. Those align with the daily 50-day SMA at $63,363 and the demand zone Pillows identified between $62,000 and $63,000.
One caveat on the heatmap data: according to CryptoRank‘s explainer on CoinGlass methodology, the liquidation estimates are modelled from open interest and assumed leverage distributions, not confirmed exchange liquidation engine outputs. They are directionally useful, not dollar-precise.
Daily momentum reads are less clear-cut. Aroon Up at 50% and Aroon Down at 14.29% favour buyers, but the moderate Aroon Up reading does not confirm a strong uptrend is underway. The 20-day SMA at $64,461 and 50-day SMA at $63,363 form a near-term support band, but BTC remains below both its 100-day and 200-day moving averages.
The weekend timing adds a structural wrinkle. CME Group‘s trading schedule confirms that CME Bitcoin futures do not trade on weekends or U.S. federal holidays. Any sharp directional move on Saturday or Sunday will therefore run through spot markets only, potentially producing a gap when CME futures reopen Monday morning.
The short-term holder cost basis at $67,523 is the level that resolves the medium-term question. Until BTC clears it convincingly, every rally into that zone is, structurally, a distribution opportunity for underwater holders.

Shawon Hannan
Shawon Hannan is a crypto markets writer at CryptoNexa. He covers DeFi protocols, layer-1 and layer-2 development, staking and restaking economics, tokenomics and the on-chain data behind the day's headlines. His reporting focuses on mechanism rather than narrative: how a protocol actually works, where the risk sits, and what the flows show. He tracks exchange reserves, TVL, funding and governance activity, and treats every figure as something that has to be traceable to a chain, a filing or a named analyst. He writes on protocol upgrades, exchange and ETF flows, regulation and market moves.