Bitcoin’s trendline support test is playing out in real time, with BTC sliding 2.49% to $64,017 as a confluence of Nasdaq-100 liquidations and surging Treasury yields pushed institutional allocators toward bonds and away from high-beta risk assets.
Treasury Yields Are Doing the Heavy Lifting on the Macro Side
The 10-year US Treasury yield climbed to 4.71%, up from 4.66% at the prior session’s close, according to the Wall Street Journal. The 2-year note moved to 4.35%, while the 30-year bond reached 5.167%, per CNBC, which also reported that Fed funds futures traders were pricing in a greater than 80% probability of a Federal Reserve rate hike at the September meeting, up sharply from 52% just one week prior, citing CME’s FedWatch tool. The Federal Reserve Bank of St. Louis tracks the 10-year yield series (DGS10) on a daily, not seasonally adjusted basis.
At these yield levels, the opportunity cost of holding BTC shifts materially. Guaranteed returns on government paper above 4.7% compress the risk premium that justifies running unhedged spot exposure through an equity drawdown.
The Nasdaq-100 closed its most recent session at 28,128 points, an eleven-week low per TradingView data, dragged down by concerns that AI infrastructure spending by major tech companies is compressing near-term free cash flows. Peter Andersen, chief executive of Andersen Capital Management, framed the market anxiety plainly: ‘People are thinking, how do we make sense of all this spending, and how much more patient do we have to be before we actually see it translate to actual profits?’
BTC’s correlation with high-growth tech has tightened enough that equity deleveraging events now register directly in crypto order books. Daily BTC trading volume hit $22.84 billion on the session, according to CoinMarketCap, with volume concentrated on the downside after an intraday high of $66,900 on 21 July.
Bitcoin Trendline Support Test Comes as Spot ETF Demand Softens
Spot Bitcoin ETFs drew just $33 million in net inflows for the week ending 24 July, the weakest weekly intake in three weeks, according to SoSoValue. That compares against a cumulative net inflow figure of $51.32 billion since the products launched in January 2024, with total net assets at $76.29 billion at the end of July, per data reported by Cointelegraph via TradingView News.
The $33 million weekly figure is not a panic rotation, but it is a sharp deceleration. Institutional allocators rotating into fixed income during a yield spike is mechanical behaviour; the concern is how long the rotation sustains if yields hold above 4.7%.
What the Charts Show at Current Levels
On the daily chart, BTC is printing below its moving average ribbon at $64,266.14, with overhead resistance at $67,303.10 (a structural distribution zone from early June) and a longer-term resistance trendline at $77,301.64. The Aroon Up sits at 71.43% versus Aroon Down at 14.29%, a mixed reading that does not confirm a trend reversal but is losing its bullish lean.
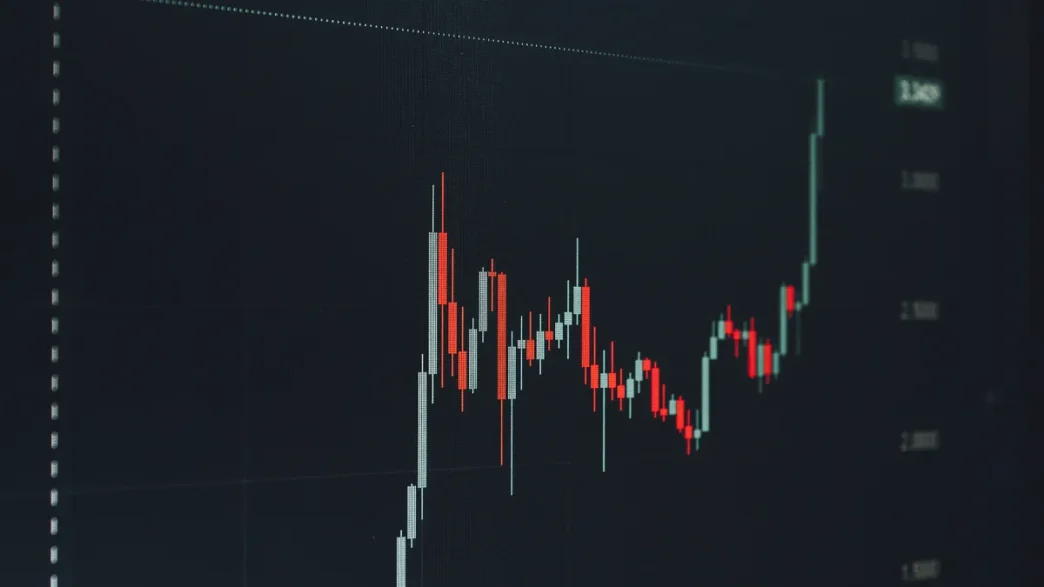
The 4-hour chart carries more urgency. BTC is actively testing an ascending trendline in place since early July, with the 4-hour RSI at 35.85, below its moving average of 42.67 and approaching oversold territory. The MACD has crossed bearish, with the MACD line at -342.39 against the signal line at -155.51, with expanding red histogram bars. Volume on down-swings is elevated, confirming active distribution rather than thin-market drift.
A daily close below the 4-hour trendline shifts the structure from a corrective pullback toward a broader reversal. The immediate downside levels to watch are $63,000 (where long liquidation cascades could accelerate), the psychological $60,000 floor, and a secondary horizontal at $60,688.54. A breach through those levels would retrace the entire recovery from May lows.
The September Fed meeting is the next hard macro catalyst. If rate-hike probability stays above 80%, the bond-versus-BTC rotation has room to extend before any relief trade has a structural reason to begin.