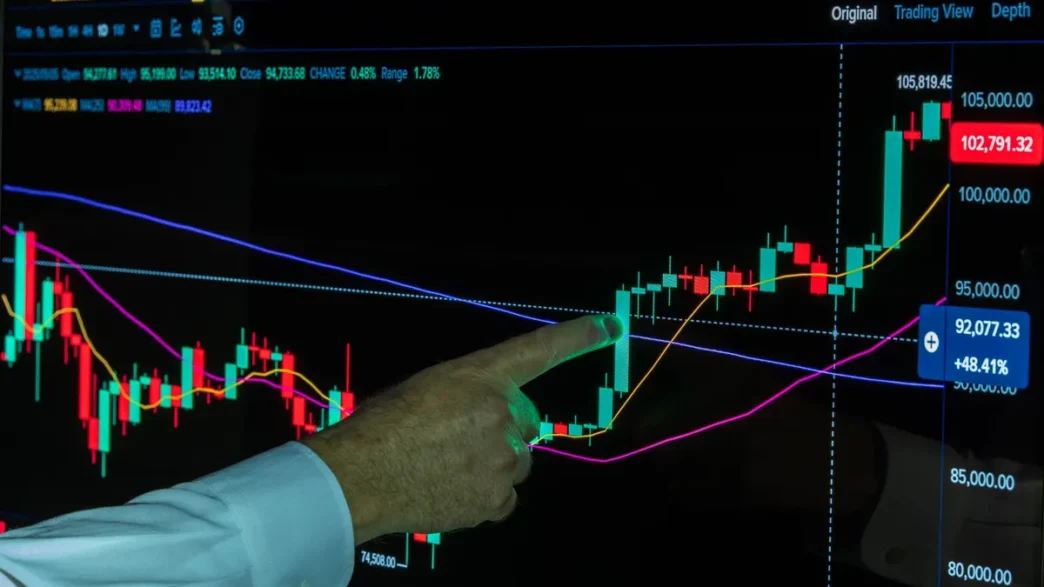
The Bitcoin weekly RSI divergence that traders have been watching for months is now confirmed, and the pattern is a close match to the setup that preceded the end of the 2022 bear market. Whether it resolves the same way is the live debate.
What the Bitcoin Weekly RSI Divergence Is Actually Saying
Weekly RSI currently sits at 58.3, its highest reading since BTC/USD printed its all-time high of $126,200 in October 2025, and it has broken a sequence of lower highs on the indicator even as price made lower lows. That structure, higher lows on RSI against lower lows in price, is the textbook definition of bullish divergence, and it has appeared at two of Bitcoin’s most consequential cycle inflections.
In mid-2022, roughly six months before the bear market ended, the weekly RSI began the same pattern. The price leg that followed is well-documented. According to TradingView News, the current setup on the two-month stochastic RSI also mirrors early 2023, with two local lows printed in late January and late March 2026 before the indicator attempted to clear its 50/100 midpoint.
Jamie Coutts, chief crypto analyst at Real Vision, was direct on the timeframe question: ‘Weekly is the timeframe that matters here, that’s where you read the secular trend and the cycle inflection points.’ Coutts described weekly bullish divergences as having ‘real weight,’ citing previous divergence events and the price moves they preceded.
The speed of the move adds context. According to TradingView News, Bitcoin ran from around $64,000 to just under $80,000 across four sessions, with daily RSI travelling from the low 40s to above 80, peaking near 90: roughly 40 points in under a week. The December 2022-to-January 2023 episode was structurally identical. Daily RSI was in the low 40s at the December 2022 low before reaching 87.40 by mid-January 2023.
Jonatan Randin, senior market analyst at PrimeXBT, flagged the same comparison to his X followers: ‘An extreme move like this usually signals the start of something new. It doesn’t necessarily mean that the bear market is over but it is telling us something. I think what it’s trying to tell us is that we are about to enter a new phase of this cycle.’
Stochastic RSI Crossover, Daily Overbought, and the Counterarguments
The two-month stochastic RSI has now printed its anticipated crossover of the two constituent trend lines, a signal that has historically preceded bullish trend changes. One complication: the indicator bottomed at only 4.81 this cycle, stopping short of the macro lows near zero that preceded crossovers in prior bear markets. According to CryptoRank, trader Quantum Ascend notes that stochastic RSI levels are currently nearly identical to those seen at the 2022 bear-market end, when price and the indicator formed a double bottom before Bitcoin rallied from its cycle low near $15,600.
On the daily chart, RSI is now at 82.93, the most overbought reading since November 2024. The split over what that means is genuine. Bitcoin uptrends have historically sustained multiple consecutive overbought periods, so a reading above 70 does not, by itself, call a top. But analyst Aksel Kibar, cited by CryptoRank, flagged that the days following the stochastic RSI setup are critical, and that a daily bear-flag breakdown remains a live risk that could send price back toward April 2026 lows near $75,000.
Separately, Caleb Franzen of financial research resource Cubic Analytics identified a bullish RSI divergence on Bitcoin relative to the S&P 500, using BlackRock’s iShares Bitcoin Trust (IBIT) against the SPY ETF as the proxy, per TradingView News. That cross-asset framing adds a layer to the bull case beyond the BTC/USD chart alone.
Spot ETF flow data offers some corroboration of renewed demand. TradingView News, citing Farside Investors, reported that US spot Bitcoin ETF net inflows across the cohort exceeded $1.6 billion in the week under analysis, with IBIT accounting for $600 million of that total.
The prior cycle’s weekly RSI breakout, covered in an earlier TradingView News analysis, took several weeks to produce a sustained directional move. The current bitcoin weekly RSI divergence is printing under similar macro pressure. Whether the stochastic RSI’s failure to reach zero is a disqualifying difference or an irrelevant detail is the question the next few weekly candles will answer.