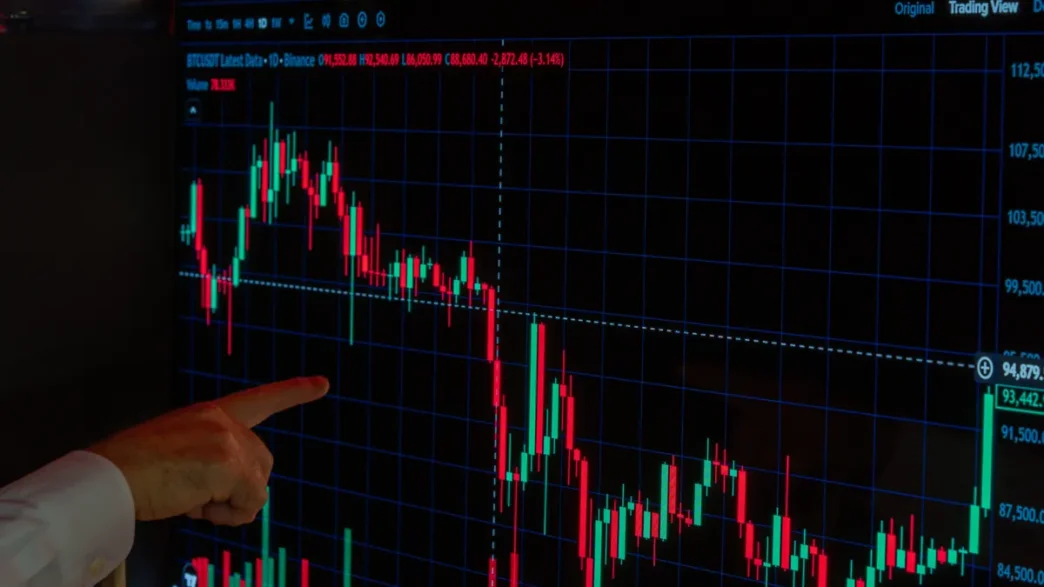
Bitcoin $80K short liquidations crossed $220 million in 24 hours as BTC/USD broke above $80,000 for the first time since 15 May, clearing a level it had not touched in roughly 100 days. The move came after the Wall Street open on Monday, with bulls extending last week’s sharp recovery into fresh territory.
Per CoinGlass futures data, Bitcoin’s open interest stood at approximately $55.36 billion at the time of data capture, with 24-hour futures volume at $59.13 billion. The short squeeze itself added pressure to an already extended move: BTC had climbed from around $64,000 the prior week to touch $80,000, a rally of close to 27% in five days, according to Altcoin Buzz.
BTC pulled back 3% intraday following the European close, with CoinGlass liquidation heatmap data pointing to a band of bid liquidity centred near $76,700 as the nearest meaningful support in a reversal scenario.
Bitcoin $80K Short Liquidations Arrive on the Back of Record ETF Demand
The price action coincided with the strongest week of spot ETF inflows since October 2025. U.S. spot Bitcoin ETFs attracted approximately $1.92 billion in net inflows during the week ended 21 August 2026, with BlackRock’s IBIT accounting for a significant portion of that demand, per Altcoin Buzz.
Macro context was also in play. Cointelegraph reported that Fed chair Kevin Warsh was in focus ahead of the Jackson Hole symposium, with U.S. PCE data due and markets still digesting the prior week’s U.S. Treasury debt buyback. Bitcoin’s best August performance since 2017 returned investor cohorts to net profit, with new money entering at $73,000.
The 50-Week Moving Average: Seven Months of Resistance
The structural question is whether BTC can hold above the 50-week exponential moving average (EMA), the line that has capped every significant rally since November 2025. Trader and analyst Rekt Capital framed it directly in his latest X commentary: ‘Bitcoin has Weekly Closed at the highs. Now starts the real test. If this is a Bear Market Relief Rally, then Bitcoin could pullback as early as this week, or at least over the next few weeks. Now it\’s all about Bitcoin proving sustained strength.’
Rekt Capital pegged the 50-week EMA at $77,251 at the time of Bitcoin’s first weekly close above it since November 2025. Crypto Briefing via TradingView reported that the breakout above the 50-week MA was driven by a 6% single-day surge that briefly pushed BTC to $81,200, accompanied by heightened whale activity and a fresh wave of short liquidations. In the days following that weekly close, BTC traded in a tight range between $81,000 and $81,450.
Galaxy Research placed the 50-week moving average at $81,796 in its own analysis, noting the week ending 23 August 2026 closed at $77,593, up 23.5% on the week. That put BTC just 5% below the indicator, the closest any weekly close had come to it since the level was lost in November 2025. Galaxy also noted the moving average had been falling toward price at roughly $987 per week over the prior two months, compressing the gap from both directions.
The history behind that indicator matters. Galaxy Research documented that the 50-week MA was lost in the week of 16 November 2025, five weeks after Bitcoin’s October all-time high, when BTC was already trading 25% below that peak. Over the 33 weeks from that November cross to the June 2026 bear-market low, every weekly close finished below the 50-week MA. Five separate rallies came within 14% of it, and each stalled.
During Bitcoin’s 2022 bear market, BTC/USD achieved two weekly closes above the 50-week trend line before eventually dropping to cycle lows. Rekt Capital flagged that precedent explicitly as the bear-case template bulls need to invalidate.
Month-to-date gains of 25% are not the issue. Sustained weekly closes above the 50-week EMA are. If BTC fades back below $77,251 on the next weekly close, the structure reverts to what it has been for nine months: a reliable ceiling, not a floor.