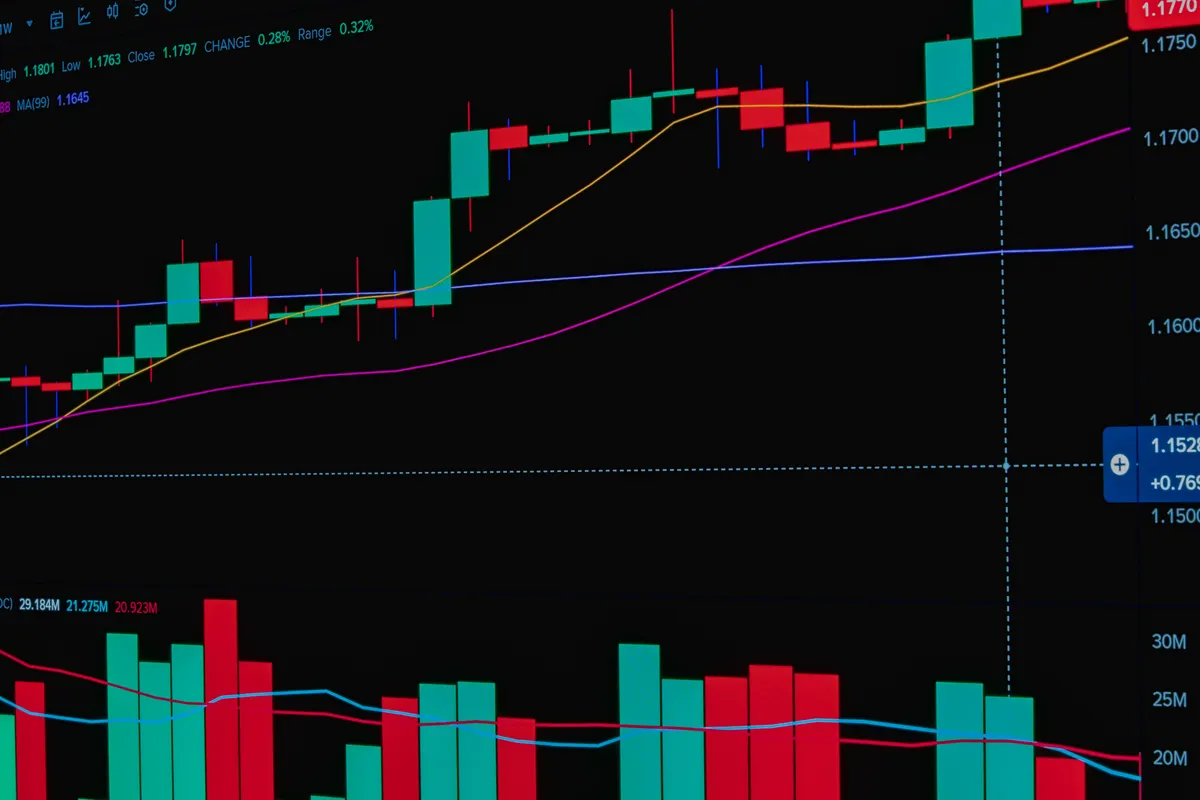
Bitcoin Realized Price Works as the Market’s Cost-Basis Anchor


Bitcoin realized price is the single metric that separates what the market paid for its coins from what those coins trade for right now, and that gap has historically defined the difference between bull-market expansion and bear-market capitulation.
Market price updates tick by tick. Realized price moves slowly, shifting only as coins actually change hands at new levels. The result is a slow-moving aggregate cost basis for every coin in circulation, calculated by dividing Glassnode’s realized capitalization metric by circulating supply. Realized cap, in turn, is built by valuing each unspent output at the price it last moved on-chain and summing everything together.
How Bitcoin Realized Price Is Calculated
The mechanics are straightforward. Take every coin, assign it the price at which it last moved between wallets, and sum those values. That sum is the realized cap. Divide by supply and you have the realized price: the average on-chain cost basis across the entire market.
A worked example keeps it concrete. Four coins last moved at $20,000, $40,000, $60,000, and $80,000. Realized cap is $200,000. Realized price is $50,000. If spot is trading at $45,000, the market is, in aggregate, underwater.
Glassnode research frames realized cap as a proxy for the value stored in the asset: it reflects what holders effectively committed, not what the market currently prices. Critically, when a coin last moved at a much cheaper price is spent again, it increases realized cap by the full difference. A coin sold at a loss pulls it back down. The metric is shaped continuously by holder behaviour.
What the Spot-to-Realized-Price Gap Actually Signals
When market price sits above realized price, the average holder is in profit. When it falls below, the aggregate market is underwater. That crossover is not just arithmetic: it has real behavioural consequences.
Holders sitting on unrealised losses are generally reluctant to sell. Supply from ordinary holders tends to dry up, while those who do capitulate sell to longer-term, value-oriented buyers. That rotation from weaker to stronger hands is the characteristic churn of a cycle bottom, and realized price is the line that marks who is above water and who is not.
The inverse applies at the top. When spot runs far above realized price, most supply sits on large paper gains, increasing the pool of potential sellers. CryptoQuant data shows MVRV ratio readings above 3.7 have repeatedly coincided with cycle tops, while readings near or below 1 have marked generational buying zones. MVRV (market-value-to-realized-value ratio) is simply market cap divided by realized cap, the same information as the price gap expressed as a ratio.
MVRV Z-Score: Normalising the Deviation
The MVRV Z-score refines that ratio by standardising the gap between market cap and realized cap against Bitcoin’s historical price volatility, measured as the standard deviation. As Bitcoin Magazine explains, that normalisation makes it possible to compare the magnitude of over- or undervaluation across cycles of very different absolute price levels.
Per CCN’s analysis, the Z-score stood at 2.43 as of 4 June 2025. For context, during the first five months of 2017, as Bitcoin moved from around $943 in January to roughly $1,363 by May, the Z-score oscillated between 3.06 and 1.45. Readings at the extreme upper band have historically flagged cycle peaks; the lower band has marked deep-value entry zones.
Cohort Realized Prices and the Broader Toolkit
Glassnode Studio calculates a realized price for short-term and long-term holder cohorts separately, using a coin-age threshold around 155 days. The short-term holder line tracks recent buyers and tends to act as nearer-term support or resistance. The long-term holder line moves slowly and marks a deeper structural floor.
When spot drops below the short-term holder cost basis, recent buyers move underwater first, historically pressuring the cohort most likely to panic-sell. When it falls below the long-term holder cost basis, even seasoned holders are in loss territory: a condition seen only in the depths of bear markets. Bitcoin Magazine Pro notes the long-term holder realized price can signal when market valuation is becoming detached from the base built by conviction buyers.
Realised price also extends beyond Bitcoin. For Ethereum, whose account-based ledger differs from Bitcoin’s UTXO model, Glassnode’s entity-based framework eliminates noise from internal transfers and change outputs, preserving the cost-basis signal while adapting it to a different chain architecture. Data providers including Coin Metrics, Glassnode, IntotheBlock, and Dune Analytics each apply their own methodologies, as Galaxy Digital research details. Supply mechanics on Ethereum (fee burn, staking flows) require additional adjustments before realized price figures are comparable to Bitcoin’s.
Where Realized Price Falls Short
Three caveats matter. First, the metric is not a timing tool. A market can trade below realized price for months in a severe bear market. Second, realized price can itself decline: when holders sell heavily at a loss, those coins move at lower prices, dragging the aggregate cost basis downward with them. What looked like a floor can drift lower.
Third, the metric assumes a coin moving on-chain represents a genuine change of ownership at market price. Exchange internal transfers and wallet consolidations can move coins without any real sale. Lost coins, permanently immovable, sit in the calculation at old prices indefinitely.
Used alongside SOPR, supply in profit or loss, and exchange flows, Bitcoin realized price is one of the most reliable lenses in the on-chain toolkit. Used as a standalone buy signal, it will disappoint. The next level to watch is whether spot can hold above the aggregate realized price through the next period of selling pressure, or whether a test of the long-term holder cost basis forces the more definitive capitulation flush the market has historically needed before a sustained recovery.

Sammie Heid | Cryptonexa
Sammie Heid is an Austin-based crypto journalist covering DeFi, NFTs, and on-chain analysis. Independent reporter since 2019. UT Austin '18. Luna survivor.