
ETH’s push toward the Ethereum price above $1,800 threshold is being fuelled by record spot ETF demand, but rising exchange reserves on Binance are complicating the picture. Ethereum traded at $1,777.49 at the time of writing, up 0.5% over 24 hours, with a session range of $1,732.10 to $1,819.88 and daily volume near $17.08 billion.
Spot ETF Inflows Hit a Record as Ethereum Price Above $1,800 Becomes the Focus
The demand backdrop has shifted materially. Spot Ethereum ETFs recorded $5.43 billion in net inflows during July, according to SoSoValue data reported by TradingView/NewsBTC. That is a 369% jump from June’s $1.16 billion and the highest monthly inflow since spot Ether ETFs launched. The streak ran to 20 consecutive days of net inflows, pushing cumulative net inflows across all spot Ether ETFs to $9.64 billion.
BlackRock’s iShares Ethereum Trust ETF (ETHA) led the charge, pulling in $4.2 billion in July alone and lifting its 2025 year-to-date total to $6.2 billion, per etf.com. On 6 July specifically, the snippet data shows ETHA recorded $29.742 million in single-day net inflows, contributing to a total net inflow of $29.082 million across all Ethereum spot ETFs that day.
The institutional angle extends further. Nasdaq filed an updated 19b-4 with the Securities and Exchange Commission (SEC) to add staking to ETHA, proposing to stake ‘all or a portion’ of the trust’s ETH through one or more staking providers, according to The Block. The filing specifies ETHA would not pool its ETH with other entities and would not bear slashing or fork risk on behalf of the trust.
ETH has gained roughly 12% from 1 July, recovering from the June selloff after buyers defended the $1,500 to $1,600 range. Weaker US jobs data and returning ETF flows were the proximate triggers.
Exchange Reserves Signal Distribution Risk
The on-chain read is less clean. CryptoQuant data shows Binance ETH reserves climbed from 3.64 million ETH in late June to 3.87 million ETH, a build of roughly 221,000 ETH (+6.1%) that one CryptoQuant analyst described as Ethereum entering a distribution phase.
That build comes after a sharp drawdown in early June: CryptoQuant data shows a synchronised decline of roughly 475,000 ETH across Binance, OKX, Gemini, and Bitfinex between 4 and 7 June, with Binance alone shedding approximately 190,000 ETH in three days. The reserves have since been rebuilt.
CryptoQuant analyst BorisD put current cross-exchange holdings at roughly 3.893 million ETH on Binance, 2.2 million on Bitfinex, 1.18 million on OKX, and 314,000 on Bybit. He flagged that inflows into Binance and OKX could add selling pressure if demand fails to absorb the extra supply. Separately, Binance users increased their ETH balances by 10.17% to approximately 4.14 million ETH in the June proof-of-reserves snapshot, though the reasons behind that rise (deposits, purchases, internal transfers) are not distinguishable from the aggregate figure.
CryptoQuant analyst Arab Chain noted a counterpoint: the ETH Binance 30-day exchange liquidity ratio rose to about 5.22, based on roughly 20.32 million ETH in 30-day trading volume against 3.8 million ETH in reserves. Each ETH held on Binance turned over more than five times during the period, suggesting the exchange can support active trading without necessarily requiring a large additional reserve build.
Key Levels: $1,796, $1,816, and the $1,750 Floor
Analyst Ali Charts identified the 0.8 MVRV Pricing Band near $1,796 as aligning with the TD Sequential resistance trendline, making it the first technical gate. He said a daily close above $1,796, followed by a hold as support, would open the TD risk line at $1,816. ‘A break above both $1,796 and $1,816 could trigger a bullish breakout,’ Ali said, placing a realised-price target near $2,245 if buyers clear those levels and hold momentum.
Daan Crypto Trades was more direct: ‘If bulls can get a daily close over $1,800, that’d be the first sign of strength for me.’
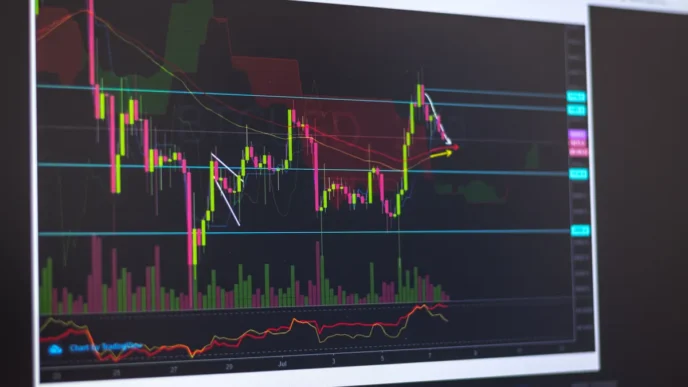
The ETH/USDT daily chart shows the MACD histogram positive at 31.83, the MACD line at -4.67 above the signal line at -36.50, and RSI at 55.95 (as of the time of writing), above both its moving average of 43.25 and the neutral 50 level. The MACD line still needs to cross above zero to confirm a structural trend shift rather than a tactical bounce.
Downside invalidation sits at $1,750 for both Ali and Daan. A loss of that level shifts focus back to $1,700. If the close above $1,800 holds, the next targets are $1,844, then $2,060 and $2,245. The staking filing for ETHA is the wildcard: approval could shift the fundamental yield case for spot ETH demand, though the SEC timeline remains open.